With the release of Solr 6 we’ve got the possibility of working with graphs when working with Solr (see more). Using the appropriate query we can retrieve documents representing a graph build out of our documents. The one missing piece was the visualization of the returned results. We thought we can fill that hole and we’ve developed a very simple tool to handle the visualization.
Using D3, Bootstrap and jQuery we’ve created a very simple tool that allows us to provide:
- Solr instance address
- Collection name
- Parent document field
- Document identifier field
- Display field
- Maximum number of documents to retrieve
- Query
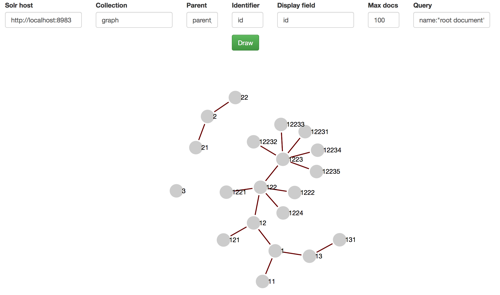
On the basis of the above information we can create a very simple visualization of the graph:
What do you need?
To visualize your graph you need Solr 6, properly indexed data (more information here) and the graph.html file that is available at our Github account (https://github.com/solrpl/solrgraph).
Instalation
To use our visualization tool all you need to do is download the mentioned graph.html file and put it into $SOLR_HOME/server/solr-webapp/webapp directory. After that you just launch your favorite web browser and go to http://localhost:8983/solr/graph.html. This is done so we can omit all the CORS related problems.
Limitations
You should remember that the functionality was developed very fast and it has a number of limitations (though we will work on them in the following weeks):
- We didn’t test it on large data sets
- CORS dependent
- It looks awful
- It doesn’t use paging
Next steps
We have a few ideas around the functionality. We would like to improve how the visualization looks and remove the dependency on CORS so that is easier to use. We will also extend the functionality to allow for filtering, providing different queries and allow control over all parameters around graph query. We would also like to hear from you, what you would like to have here and of course we will accept any pull requests on Github, help is welcome 🙂